My first job for printed press and how I learned InDesign in one day
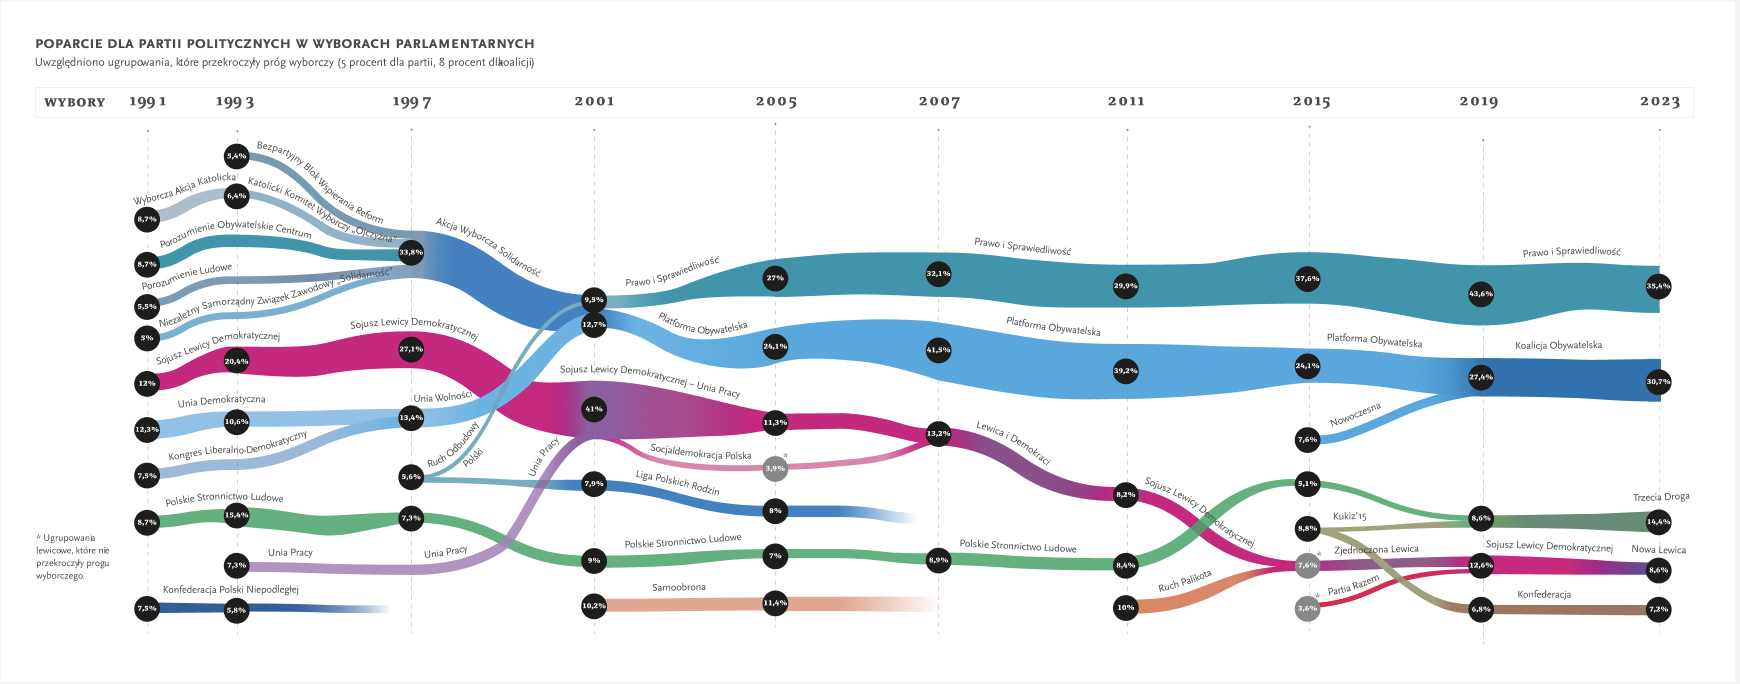
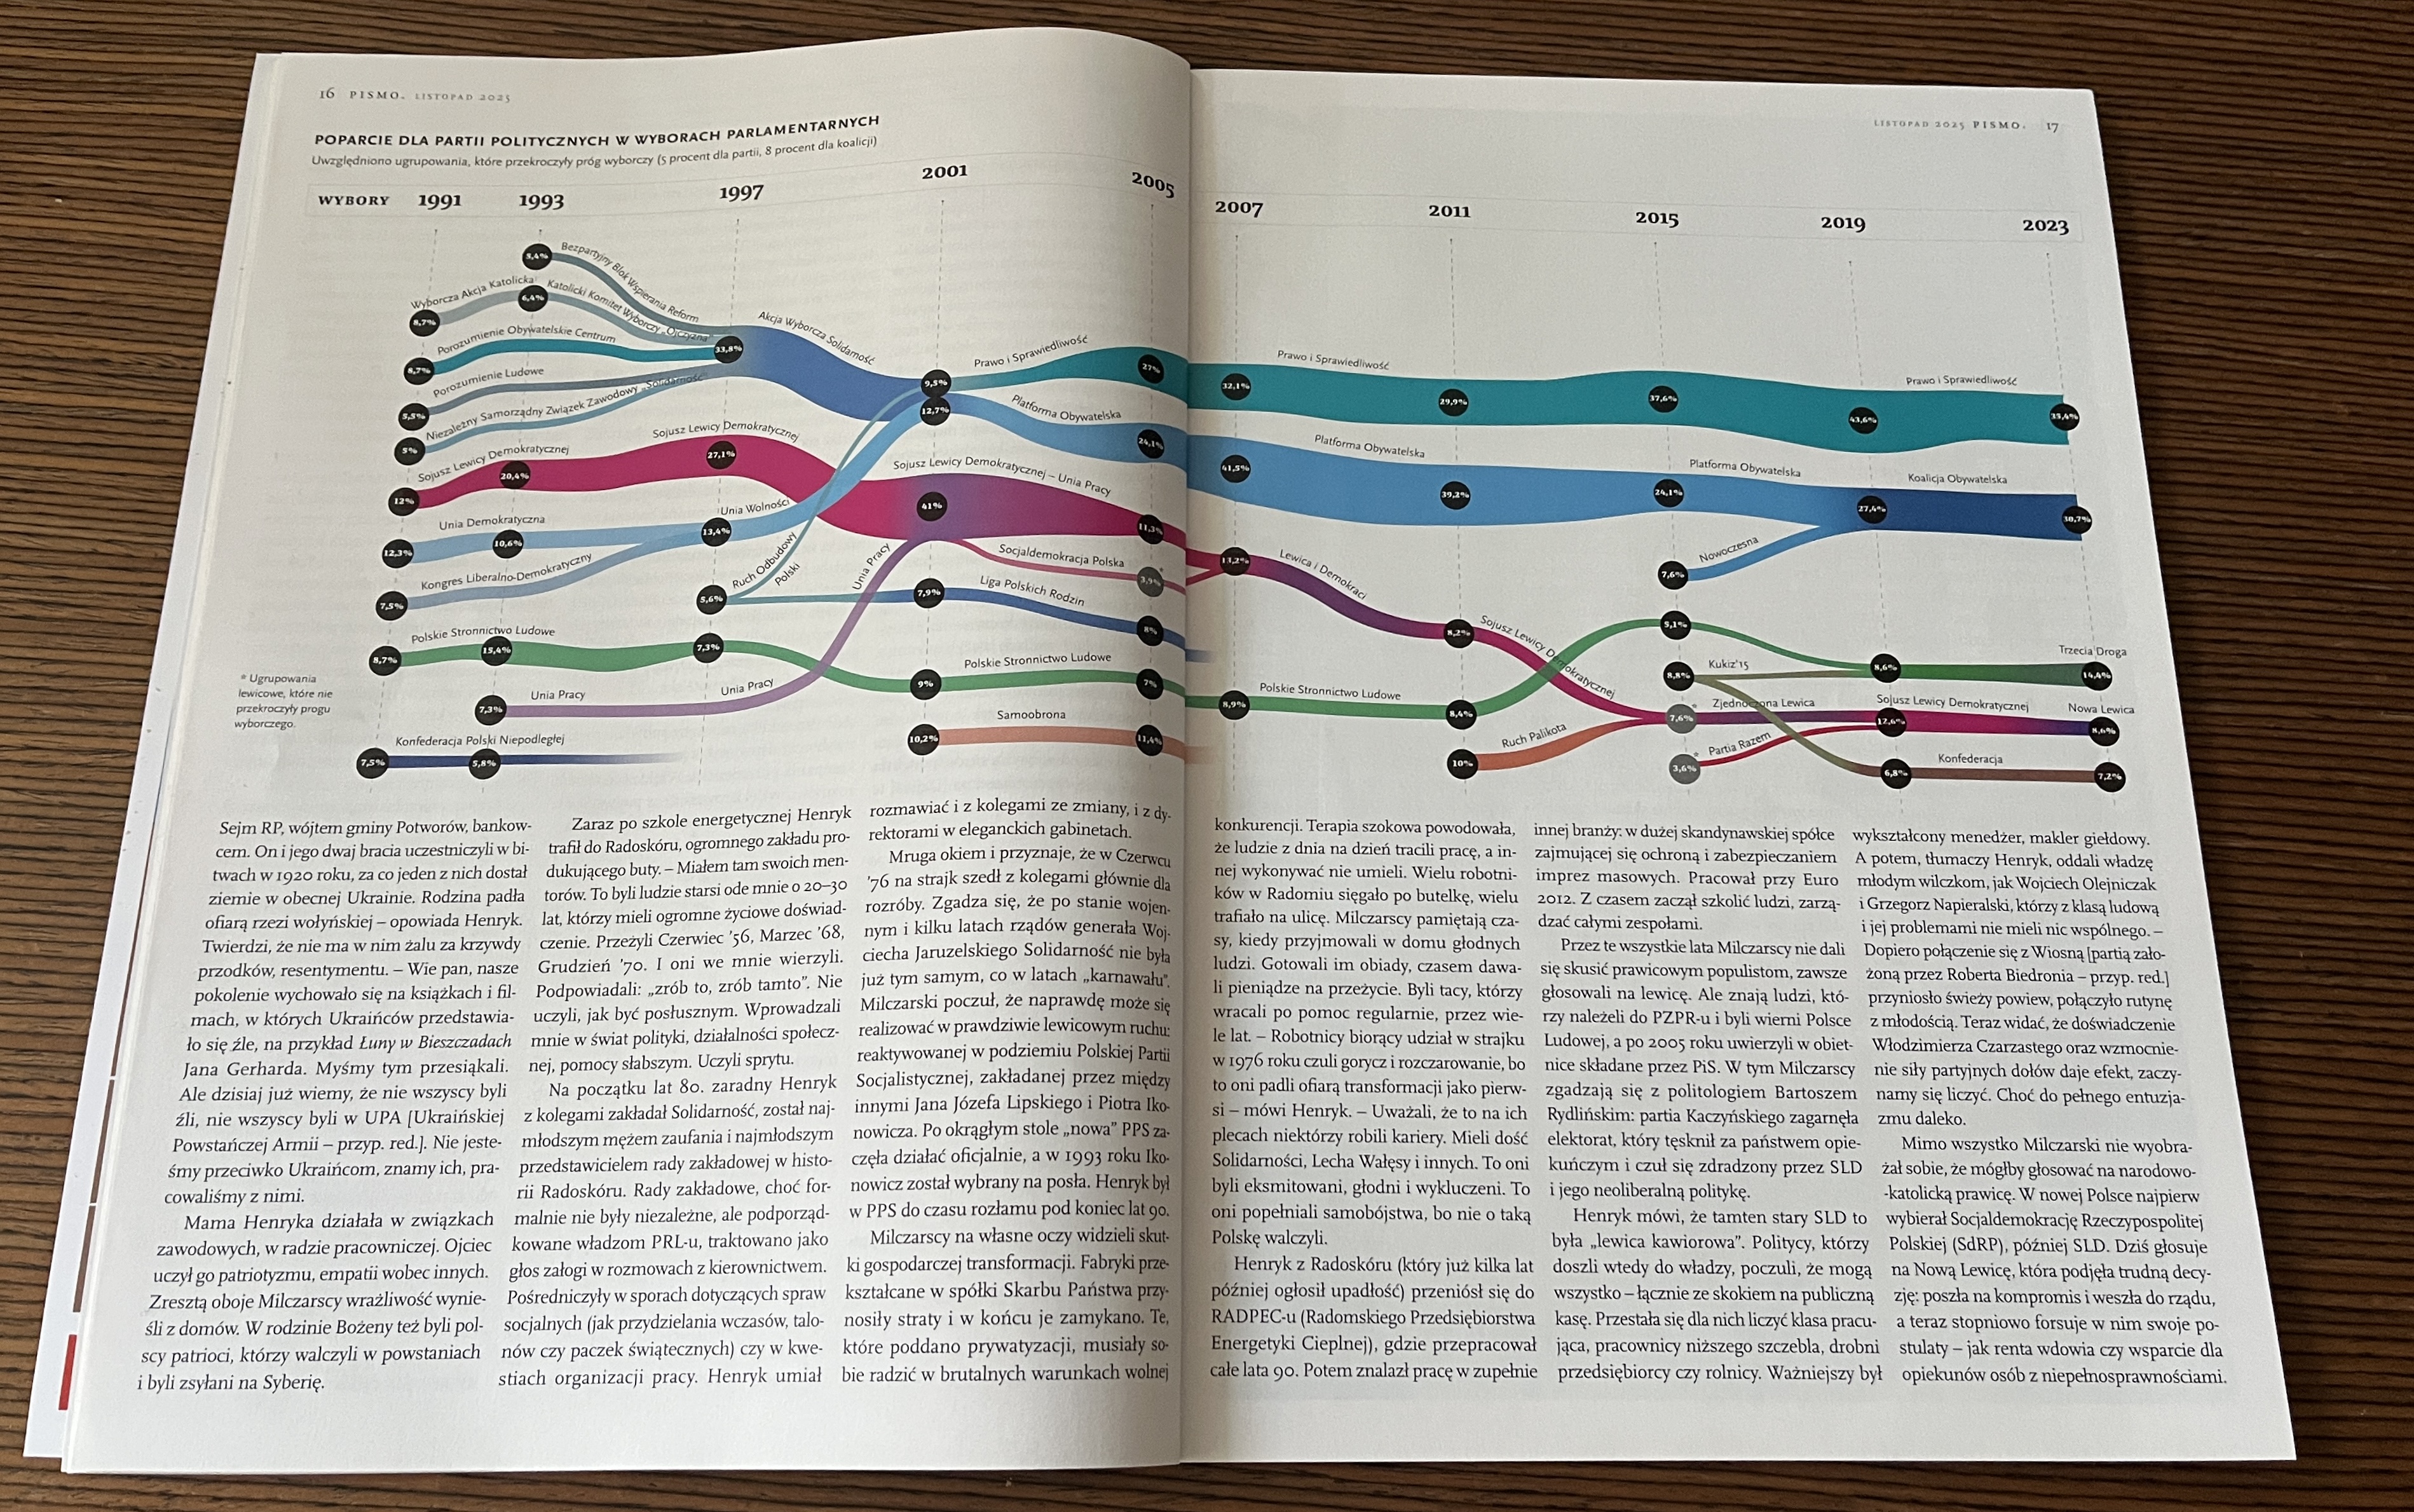
A Sankey diagram tracing thirty years of Polish political party history, built from Wikipedia election data scraped into Flourish and exported as SVG, then refined in Illustrator and InDesign for print — published in Pismo magazine. Below is how it came together.
I pitched a data visualization to a Polish lifestyle magazine. They said yes. Then I realized I had no idea how to actually deliver it for print.
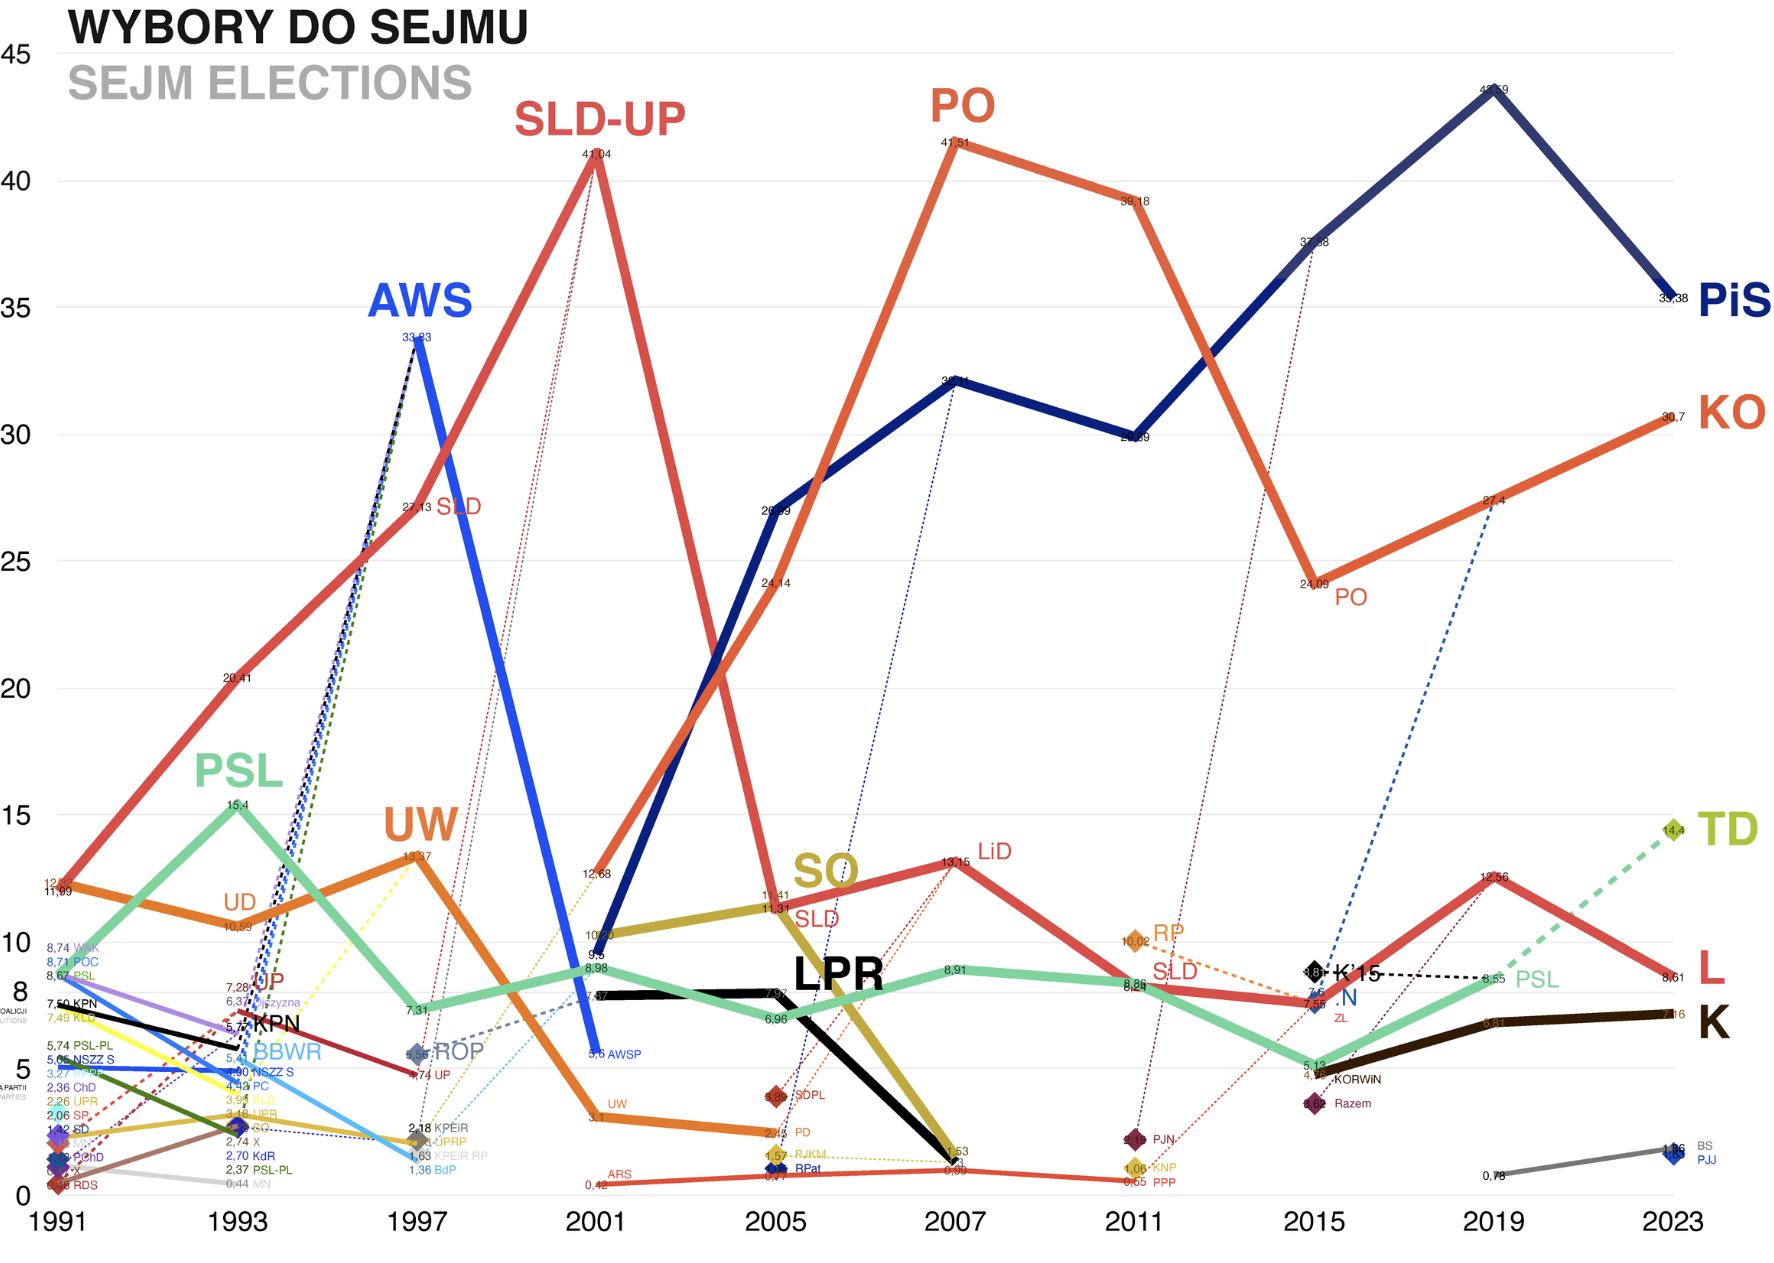
Pismo is a Polish lifestyle magazine — not the obvious home for a political party map. When I started my Political Science master’s in Poland, my entrance exam was an oral test on… Polish politics. I passed, but only after cramming a 700-page book in a month and memorizing every politician, party, and scandal. So when my friend was writing a big piece about the history of Polish politics for Pismo, I convinced his editors they needed a visualization. My argument: outside the academic bubble, no one remembers what parties even existed in the ’90s. And everything that exists online looks like this.
I figured a good way to show the past is to make it look like the past. My initial idea was to style the ’90s section like an old newspaper — yellowed, grainy, and then let the design gradually modernize as the diagram moves toward the present day. I am not an artist (yet?), so it stayed as an idea. But it shaped how I thought about the whole thing.
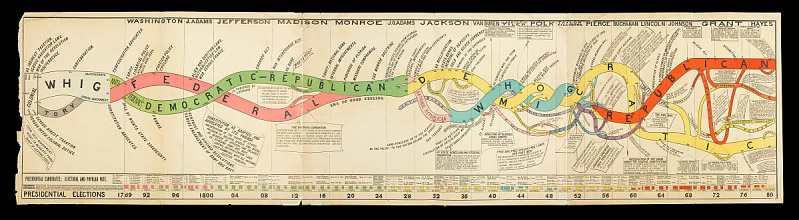
When I googled “history of political parties” for inspiration, everything I found was about the US, of course. So this became my reference point:
The viz I had in mind was a Sankey diagram — flows showing how parties split, merged, and disappeared over three decades. Here’s what the process looked like.
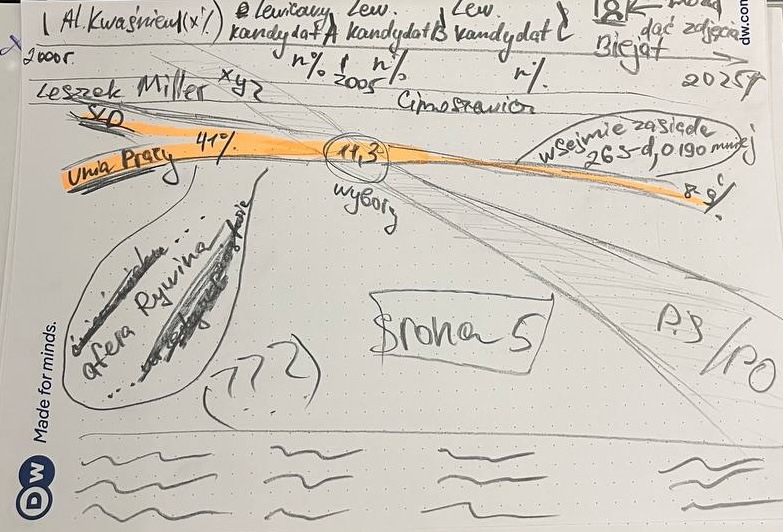
I started with a pencil and a highlighter.
Then I scraped Wikipedia pages with election results to fill the sketch with real data.
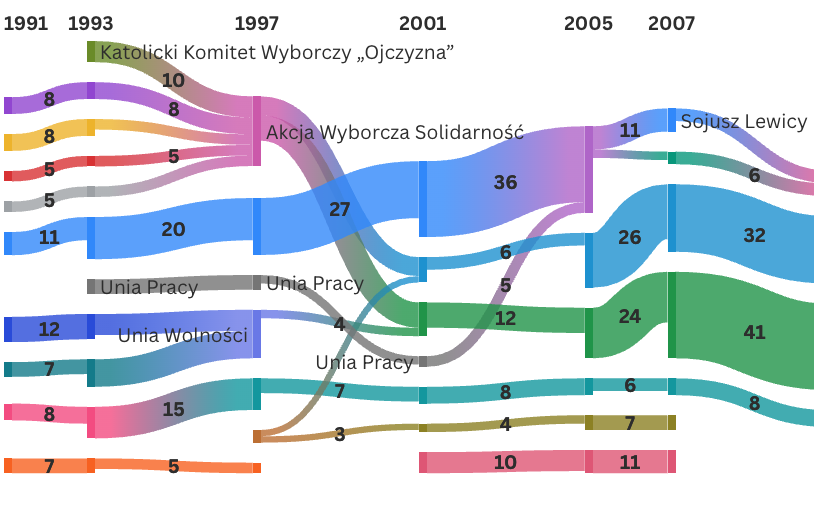
A Sankey template from Flourish became an SVG, which then took a trip to Illustrator and InDesign to get cleaned up and styled.
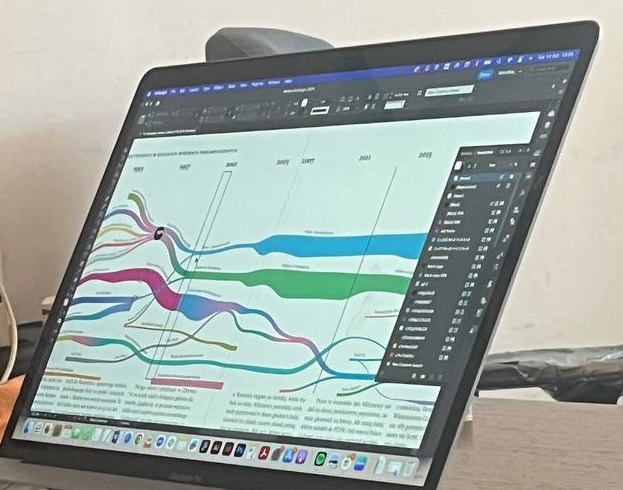
And here’s the final result.
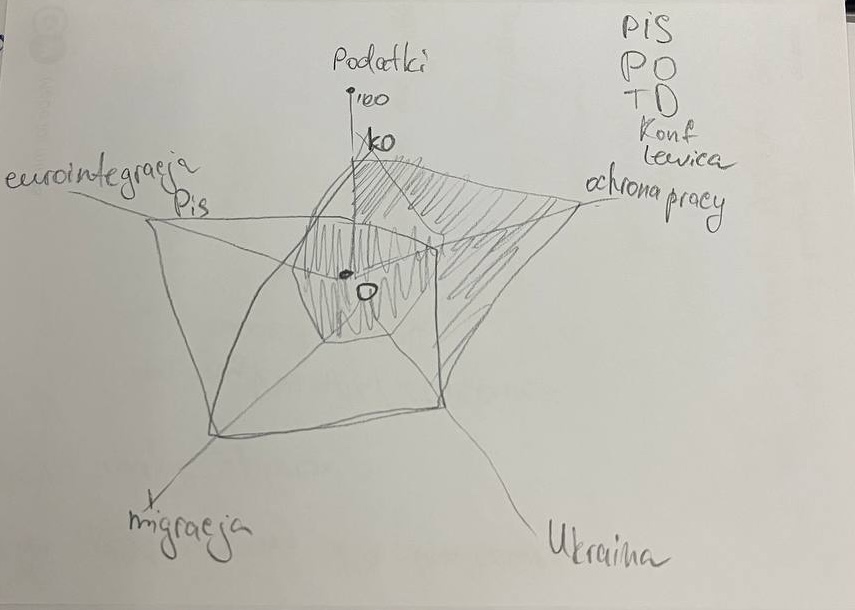
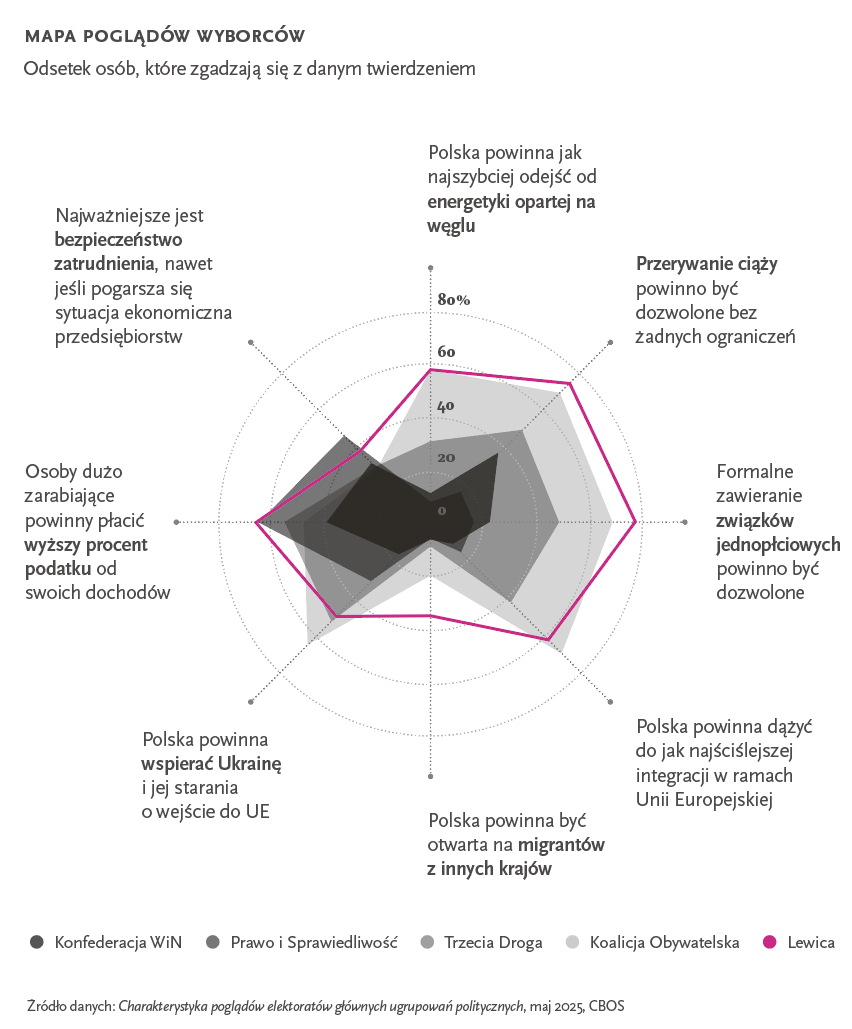
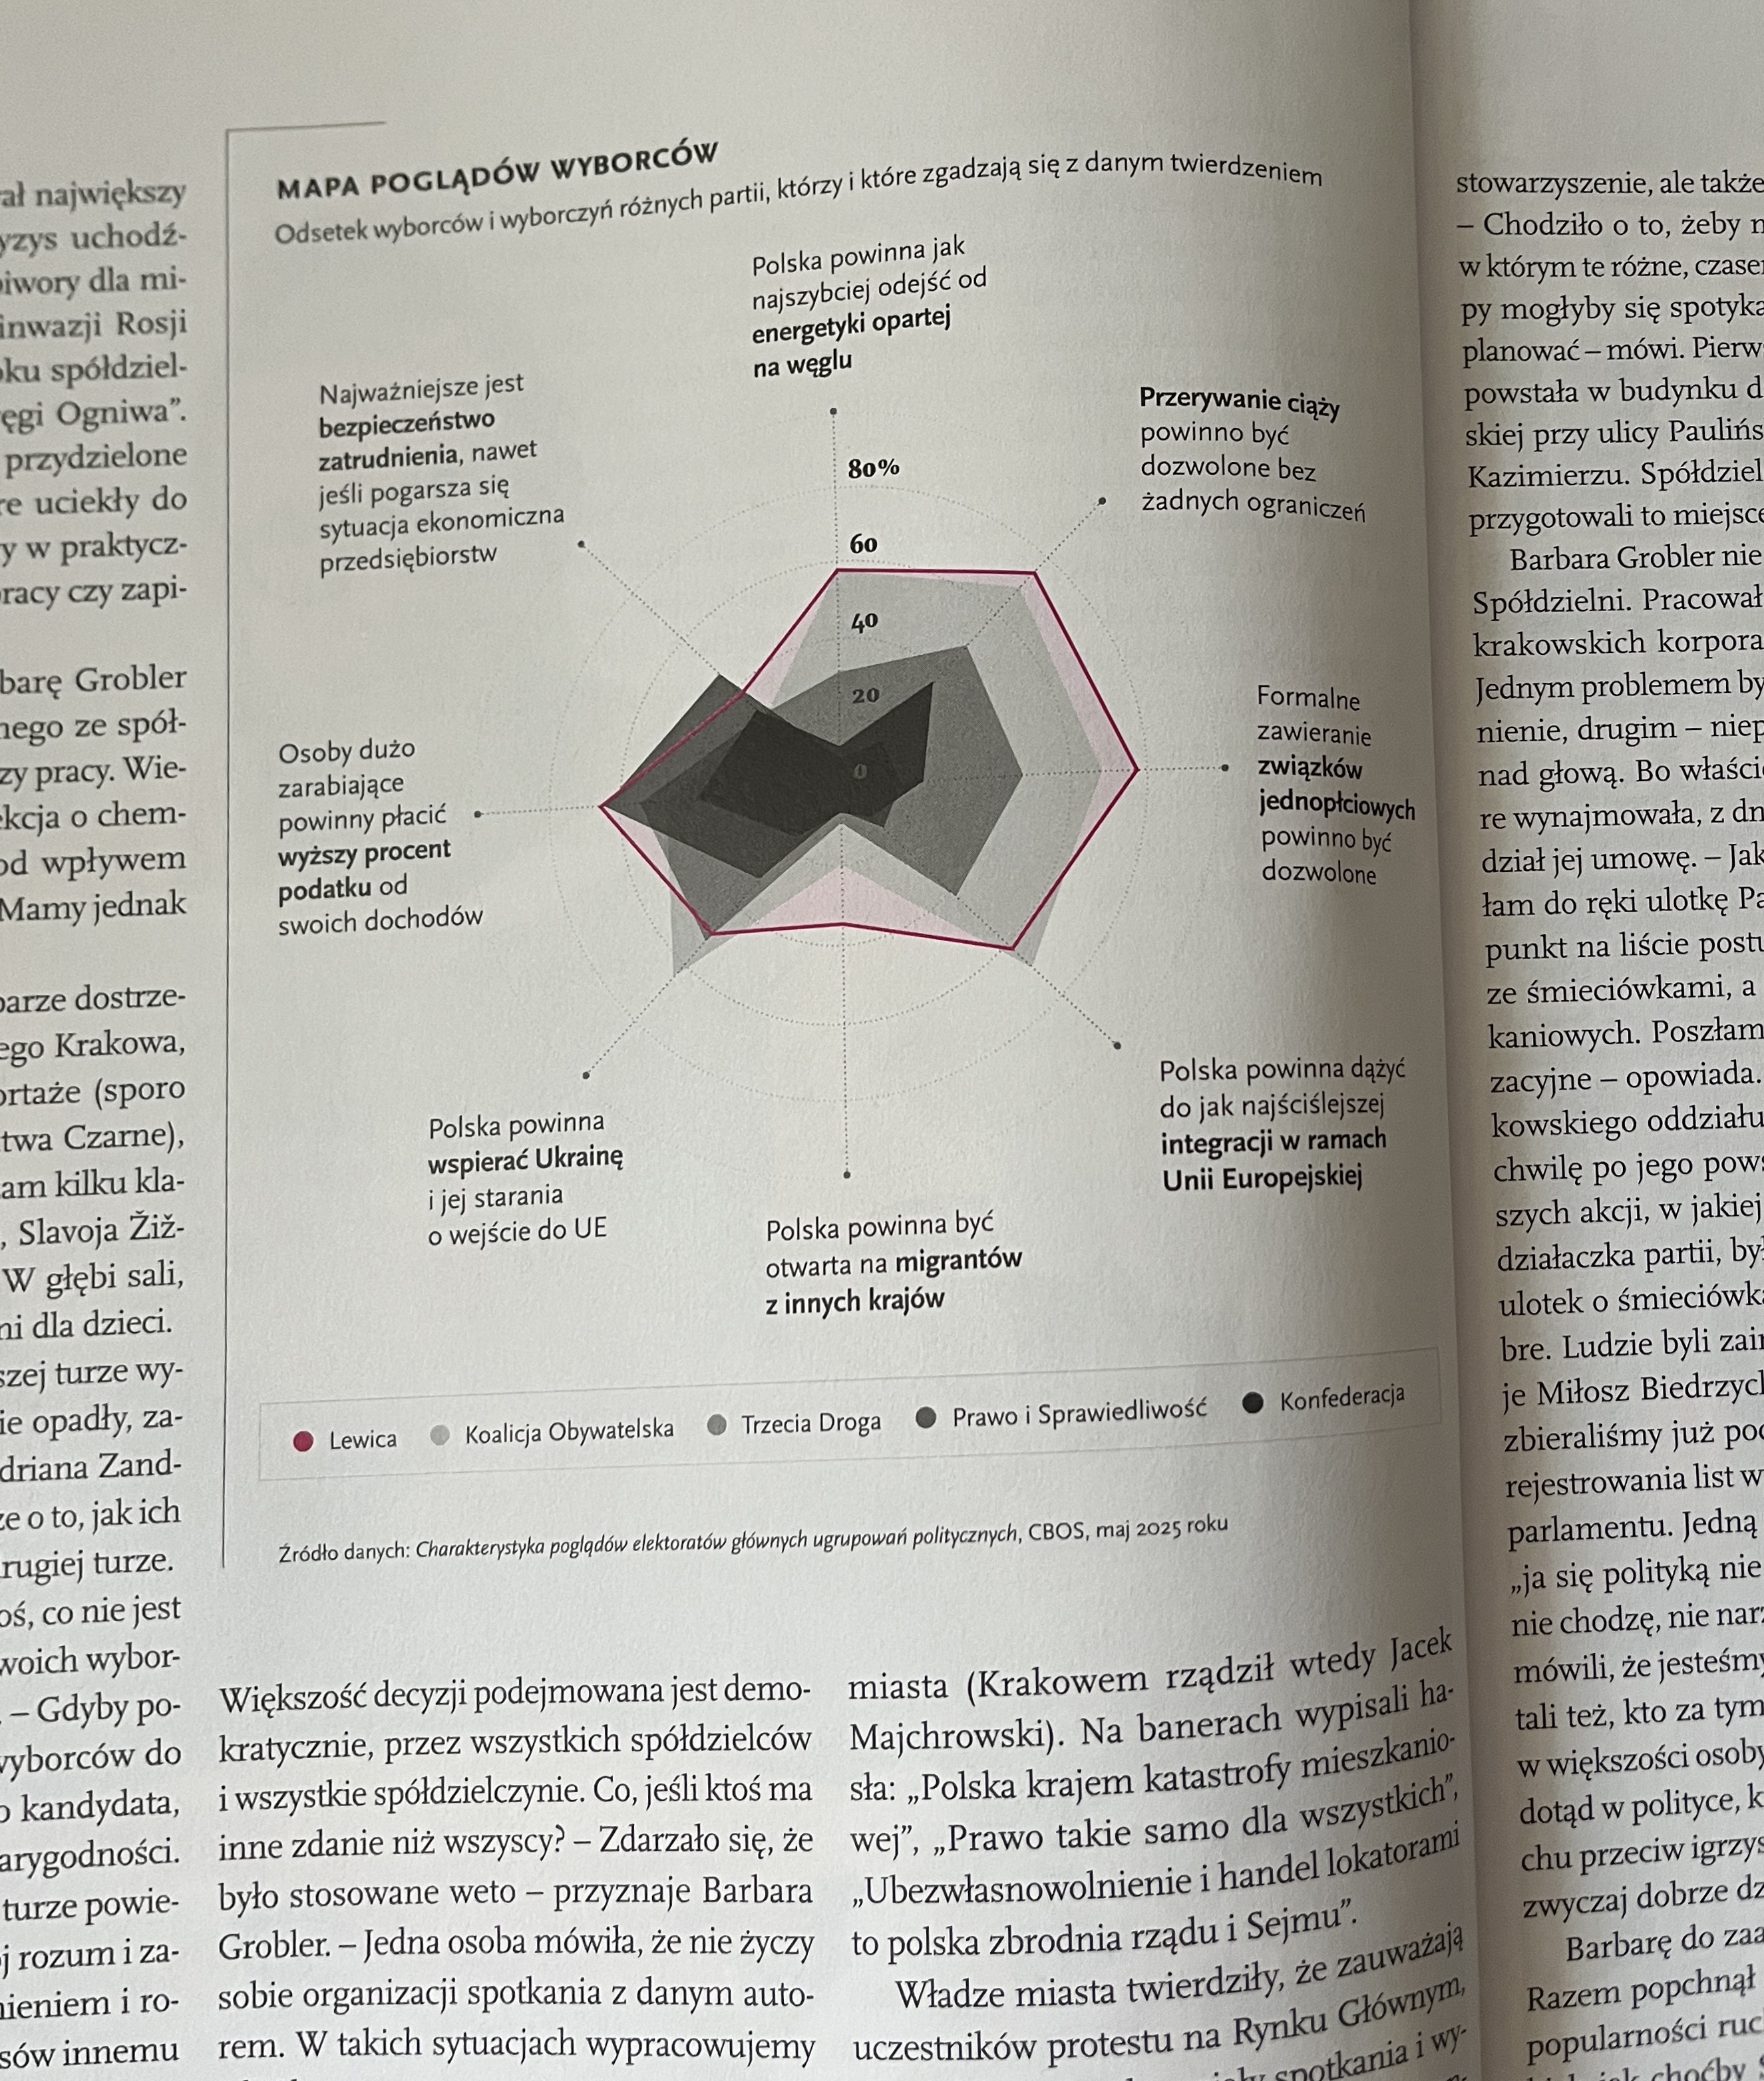
The same story also needed a radar diagram showing political preferences in Poland. Here’s a sketch.
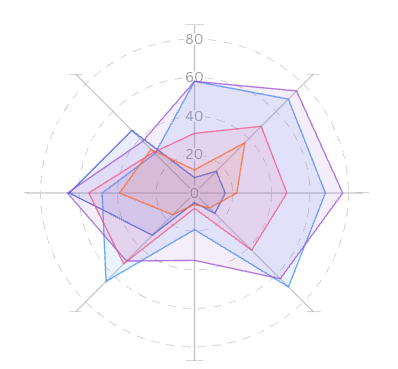
A radar diagram built in Flourish.
Final print-ready version.
Here’s what it all looks like in the magazine:
Now here’s the part nobody tells you about pitching to print: I work in Illustrator. It is great — until the editor asks for print-ready files.
So I had one day to learn InDesign and somehow got it done.