How I created an ML model to uncover drug-trafficking on Telegram
I scraped 500,000 messages from 1,500 Telegram channels using Telethon and a snowballing method, then built a Doc2Vec classifier trained on 300 manually labeled drug ads to identify advertisements at scale. The investigation showed that Poland’s online drug market runs on Telegram, InPost parcel lockers, and BLIK — the full story is here, and below is how I built it.
The story started with a simple question: how does buying drugs in Poland actually work in 2024? The answer turned out to be surprisingly mundane — Telegram channels, InPost parcel lockers, and BLIK, the same instant payment system you’d use to pay a friend back for coffee. We wanted to show the scale of it, which meant we needed data. A lot of it.
Step 1: Find the channels
Through manual searching, we identified 70 Telegram groups openly advertising drugs. That was the starting point. Using the Telethon library, I extracted messages and metadata from those groups — and inside them, I kept finding recommendations for other channels. That’s the snowballing method: you start with what you can find, then follow the links. By the end, we had a database of 1,500 channels.
From each channel, I scraped the last 1,000 messages (or fewer if the channel hadn’t posted that much), stripped out empty messages and anything not in Polish, and ended up with a dataset of 500,000 messages.
Step 2: Teach the model what a drug ad looks like
Half a million messages is too many to read manually. So I built a classifier.
First, I went back to the original 70 channels and manually labeled 300 messages as drug advertisements — posts that explicitly named a substance and listed a price. That became my training set.
I then created a Doc2Vec model and trained it on those 300 labeled examples, generating vector representations for each message. The idea is simple: messages that talk about the same things end up close to each other in vector space. Drug ads cluster together.
Then I ran the full 500,000-message dataset through the model, calculated similarity scores between each message and the training vectors, set a threshold, and classified everything above it as a drug advertisement.
Step 3: Count what matters
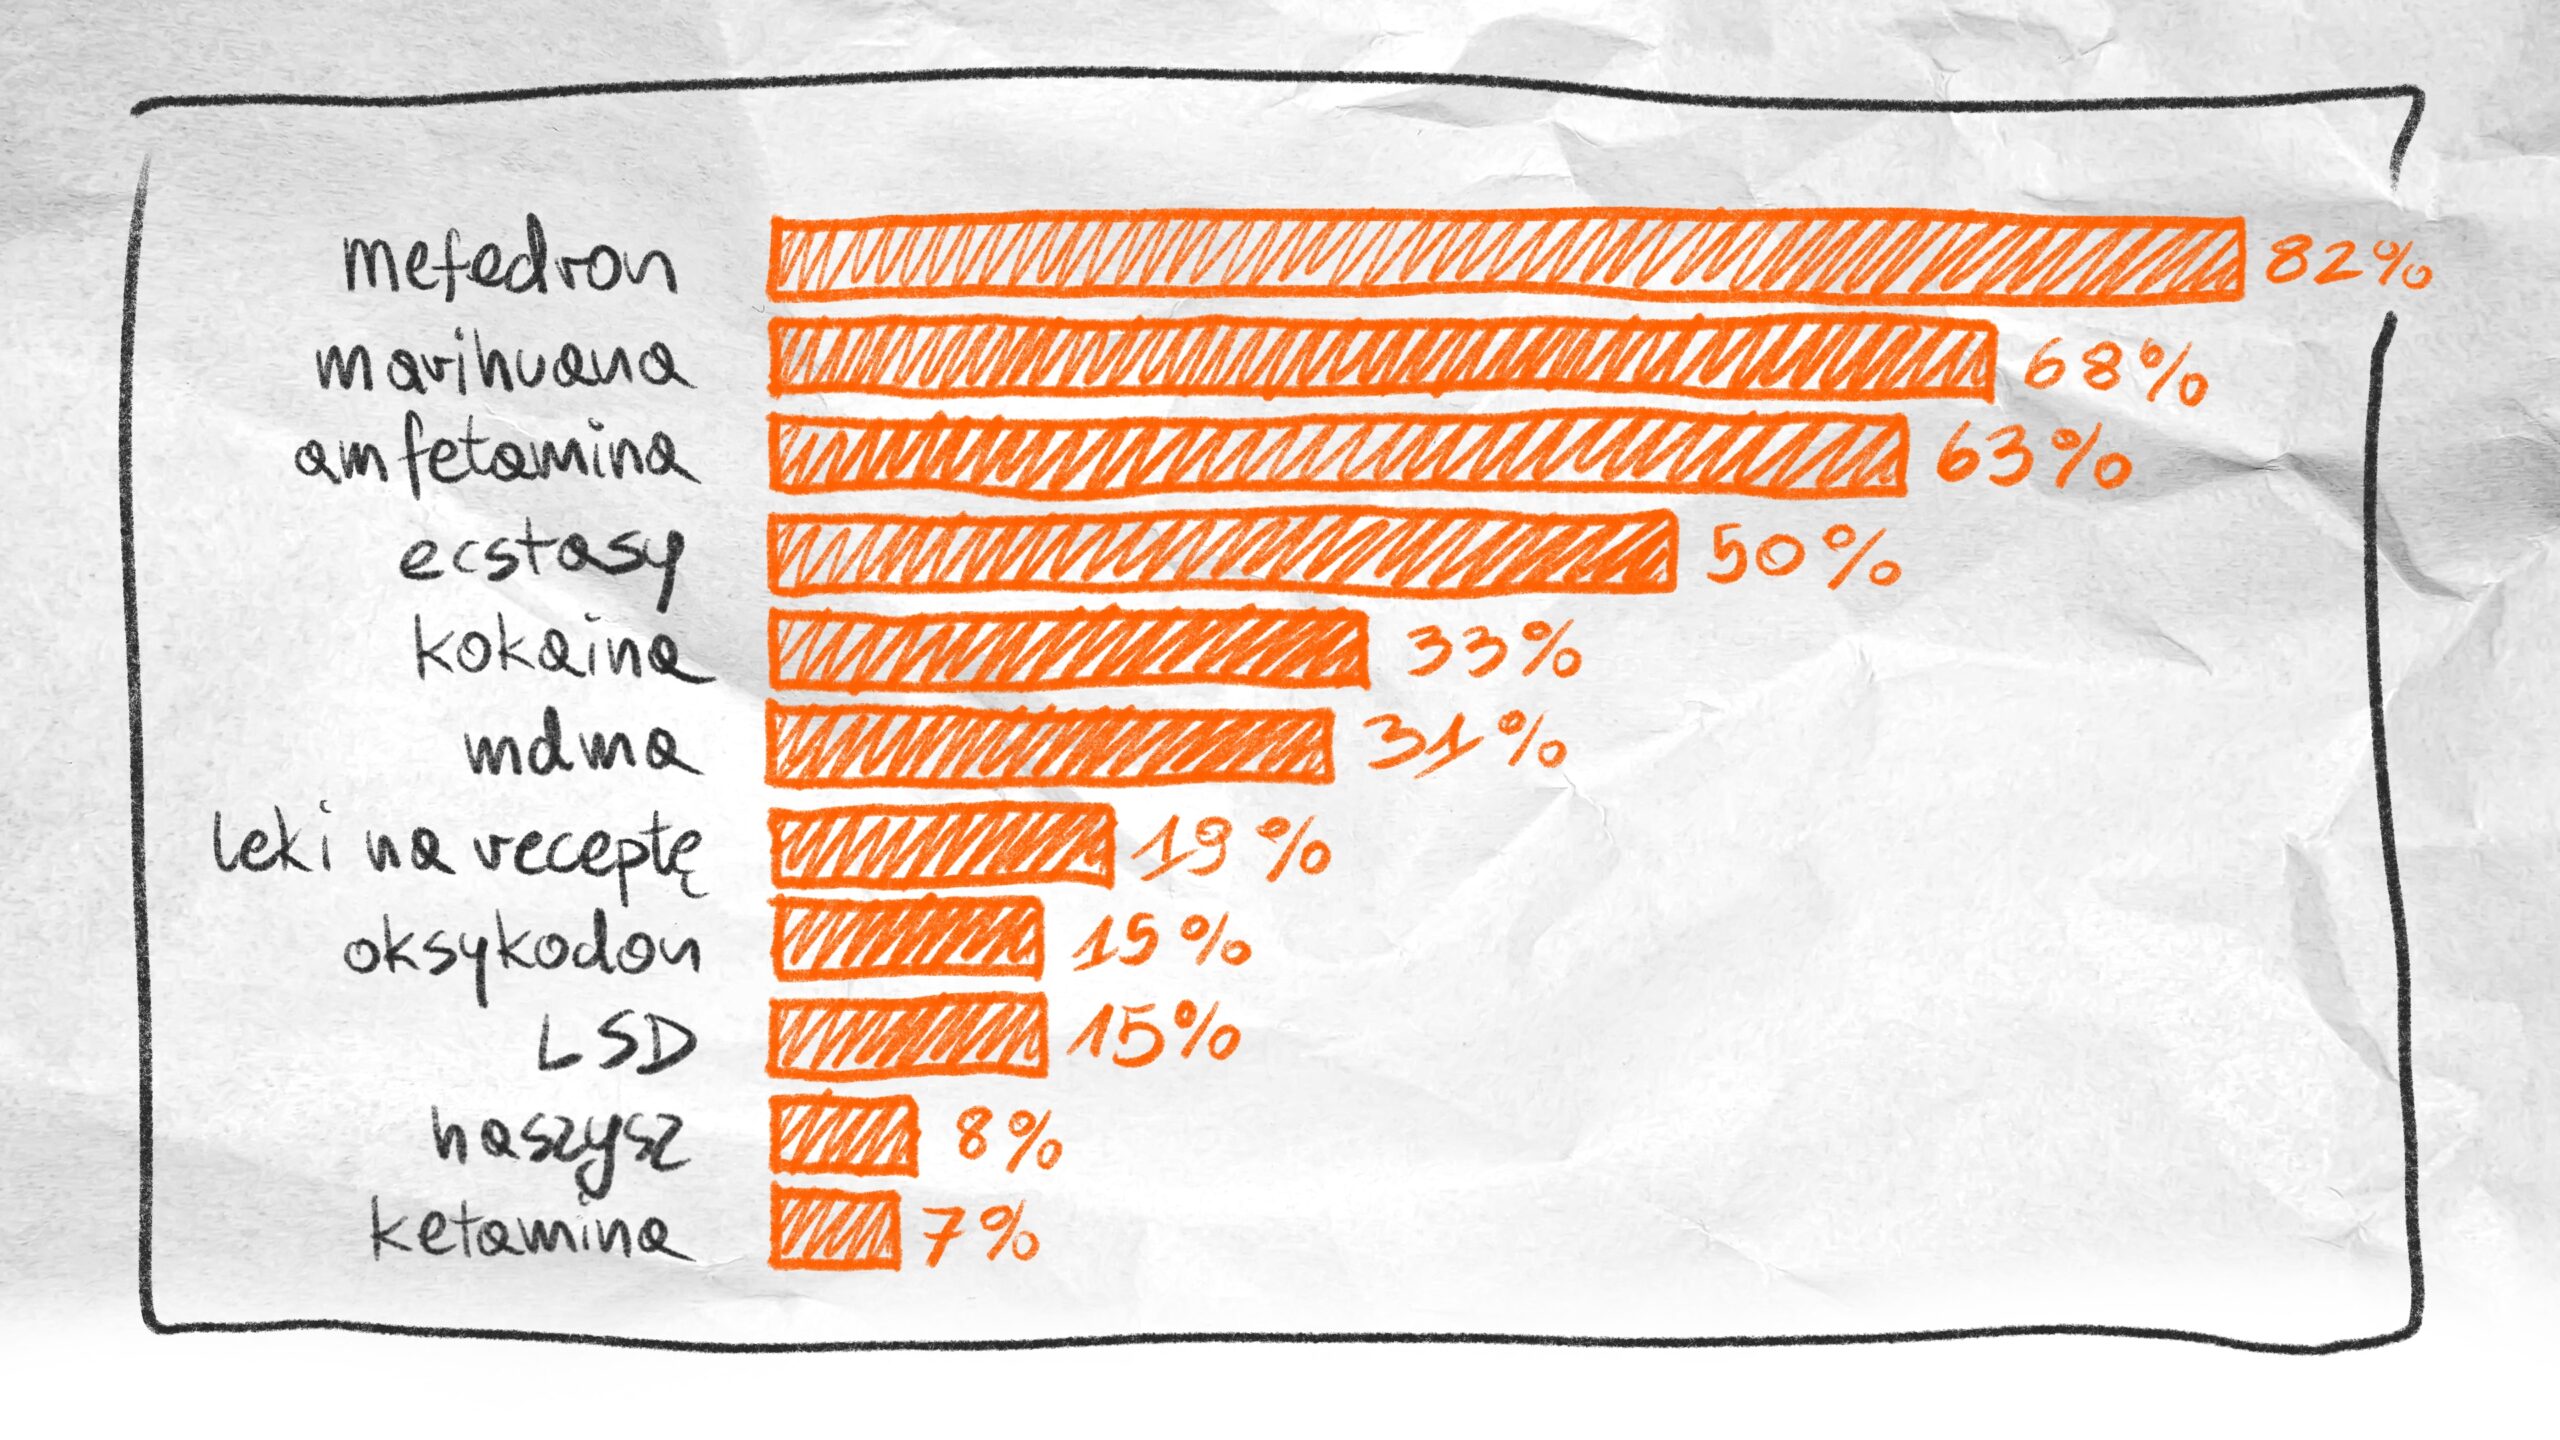
Once I had the classified ads, the analysis was more straightforward. I built a library of drug slang and proper names and used a string-matching method to calculate what percentage of ads mentioned specific substances. I also counted unique senders — which gave us a rough count of dealers — and flagged how often InPost and BLIK came up, which told the story of how the market actually works.
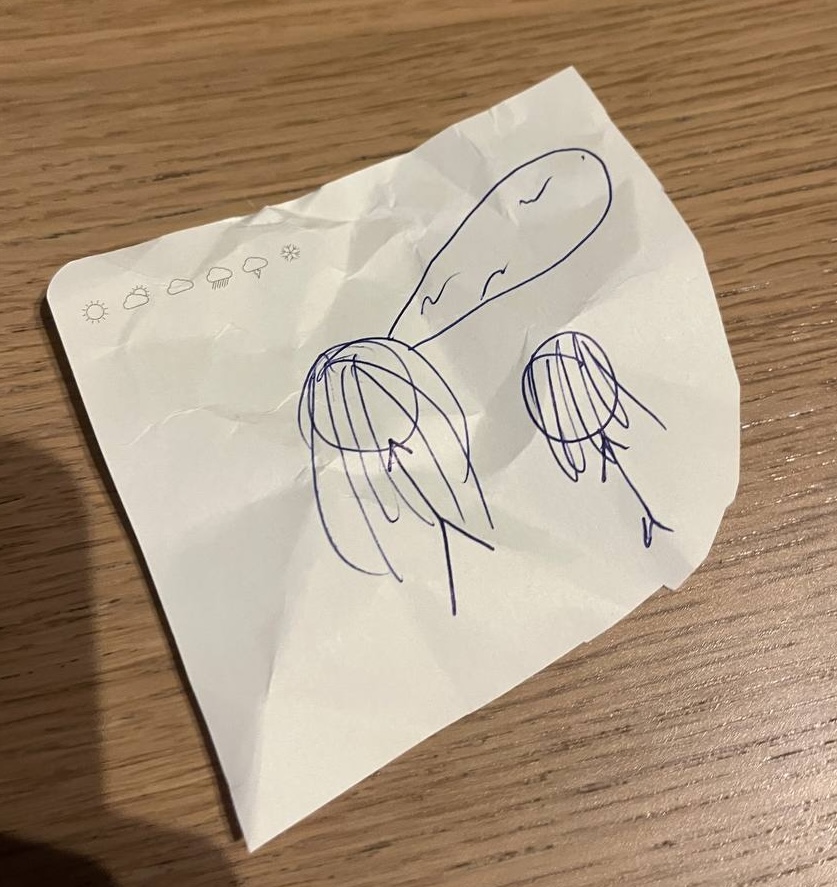
This is the brief I sent to the illustrator:
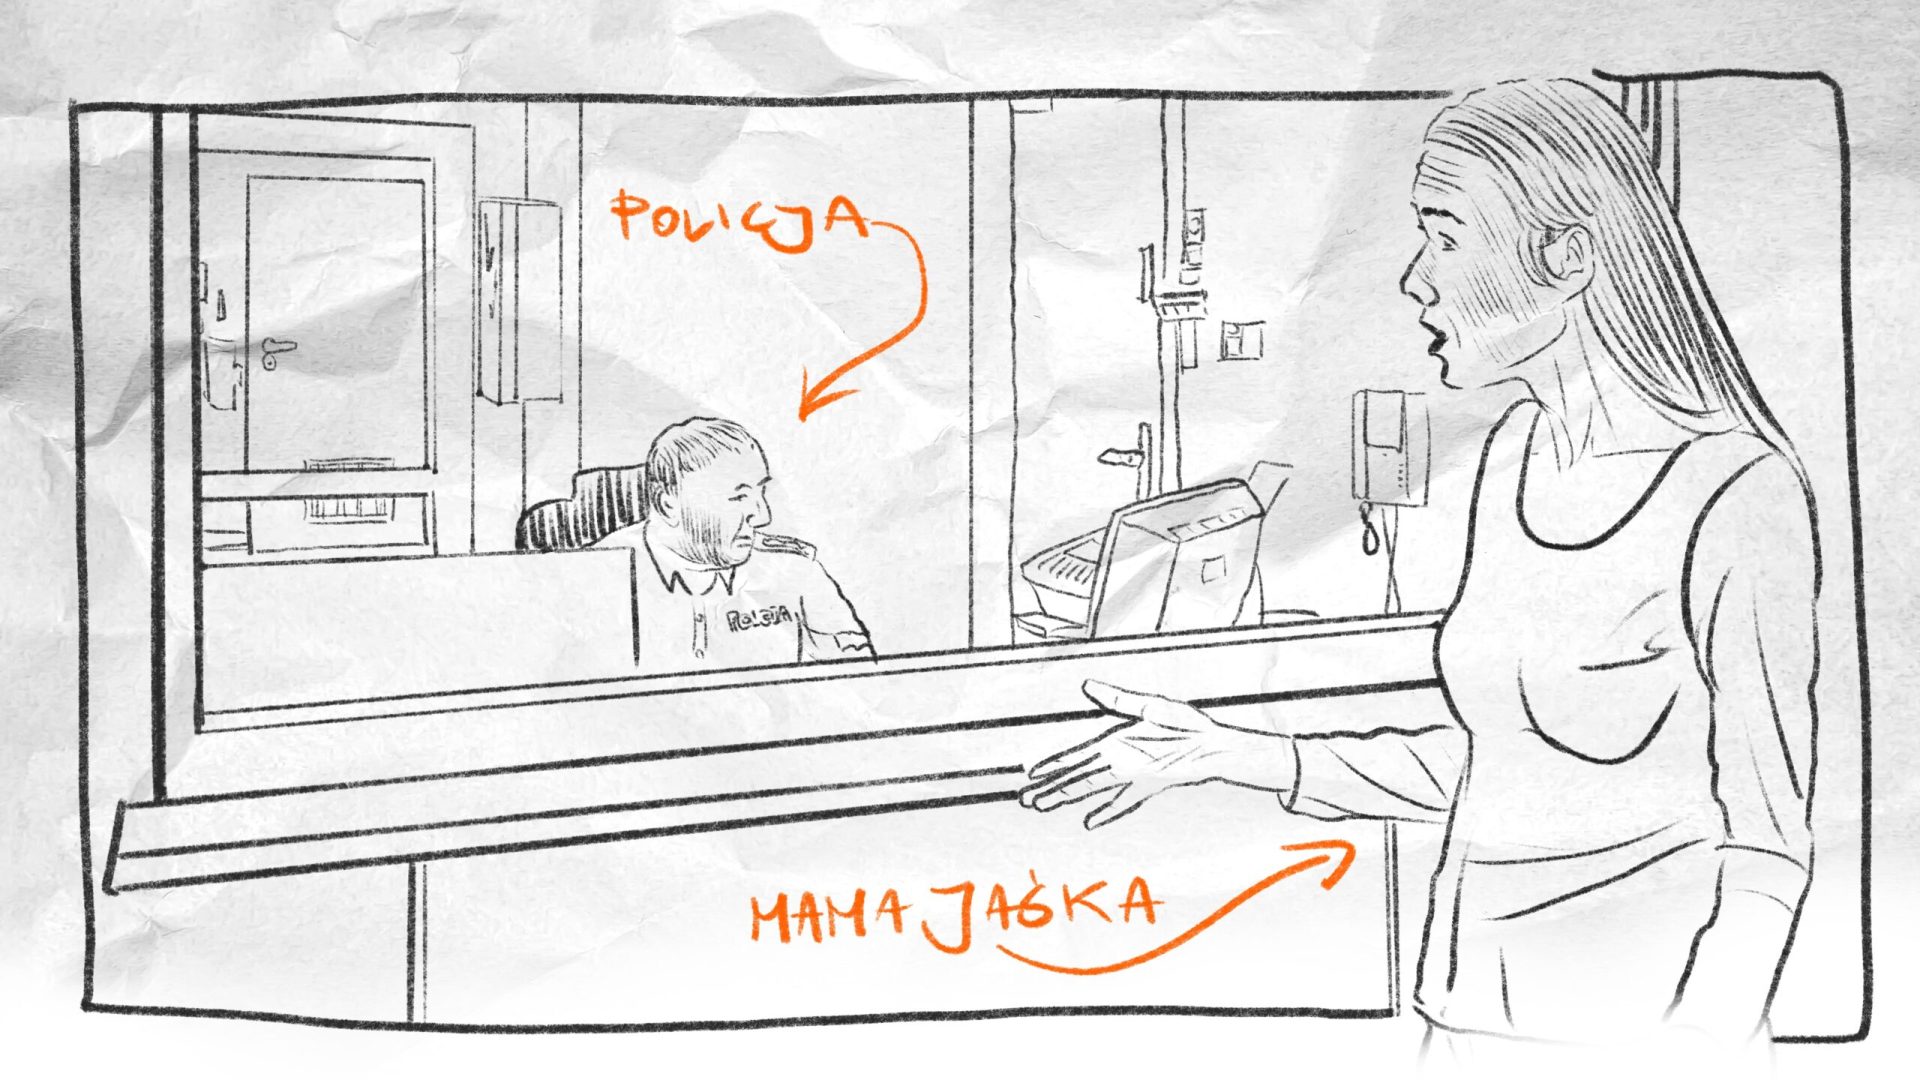
And here’s what she came up with:
I was the only data journalist on the team, which meant every part of this pipeline — scraping, modeling, analysis — was mine to figure out. If I’d had more time, I would’ve pushed harder on the visualization side. But some stories are there to challenge your Python skills, and this was one of them.
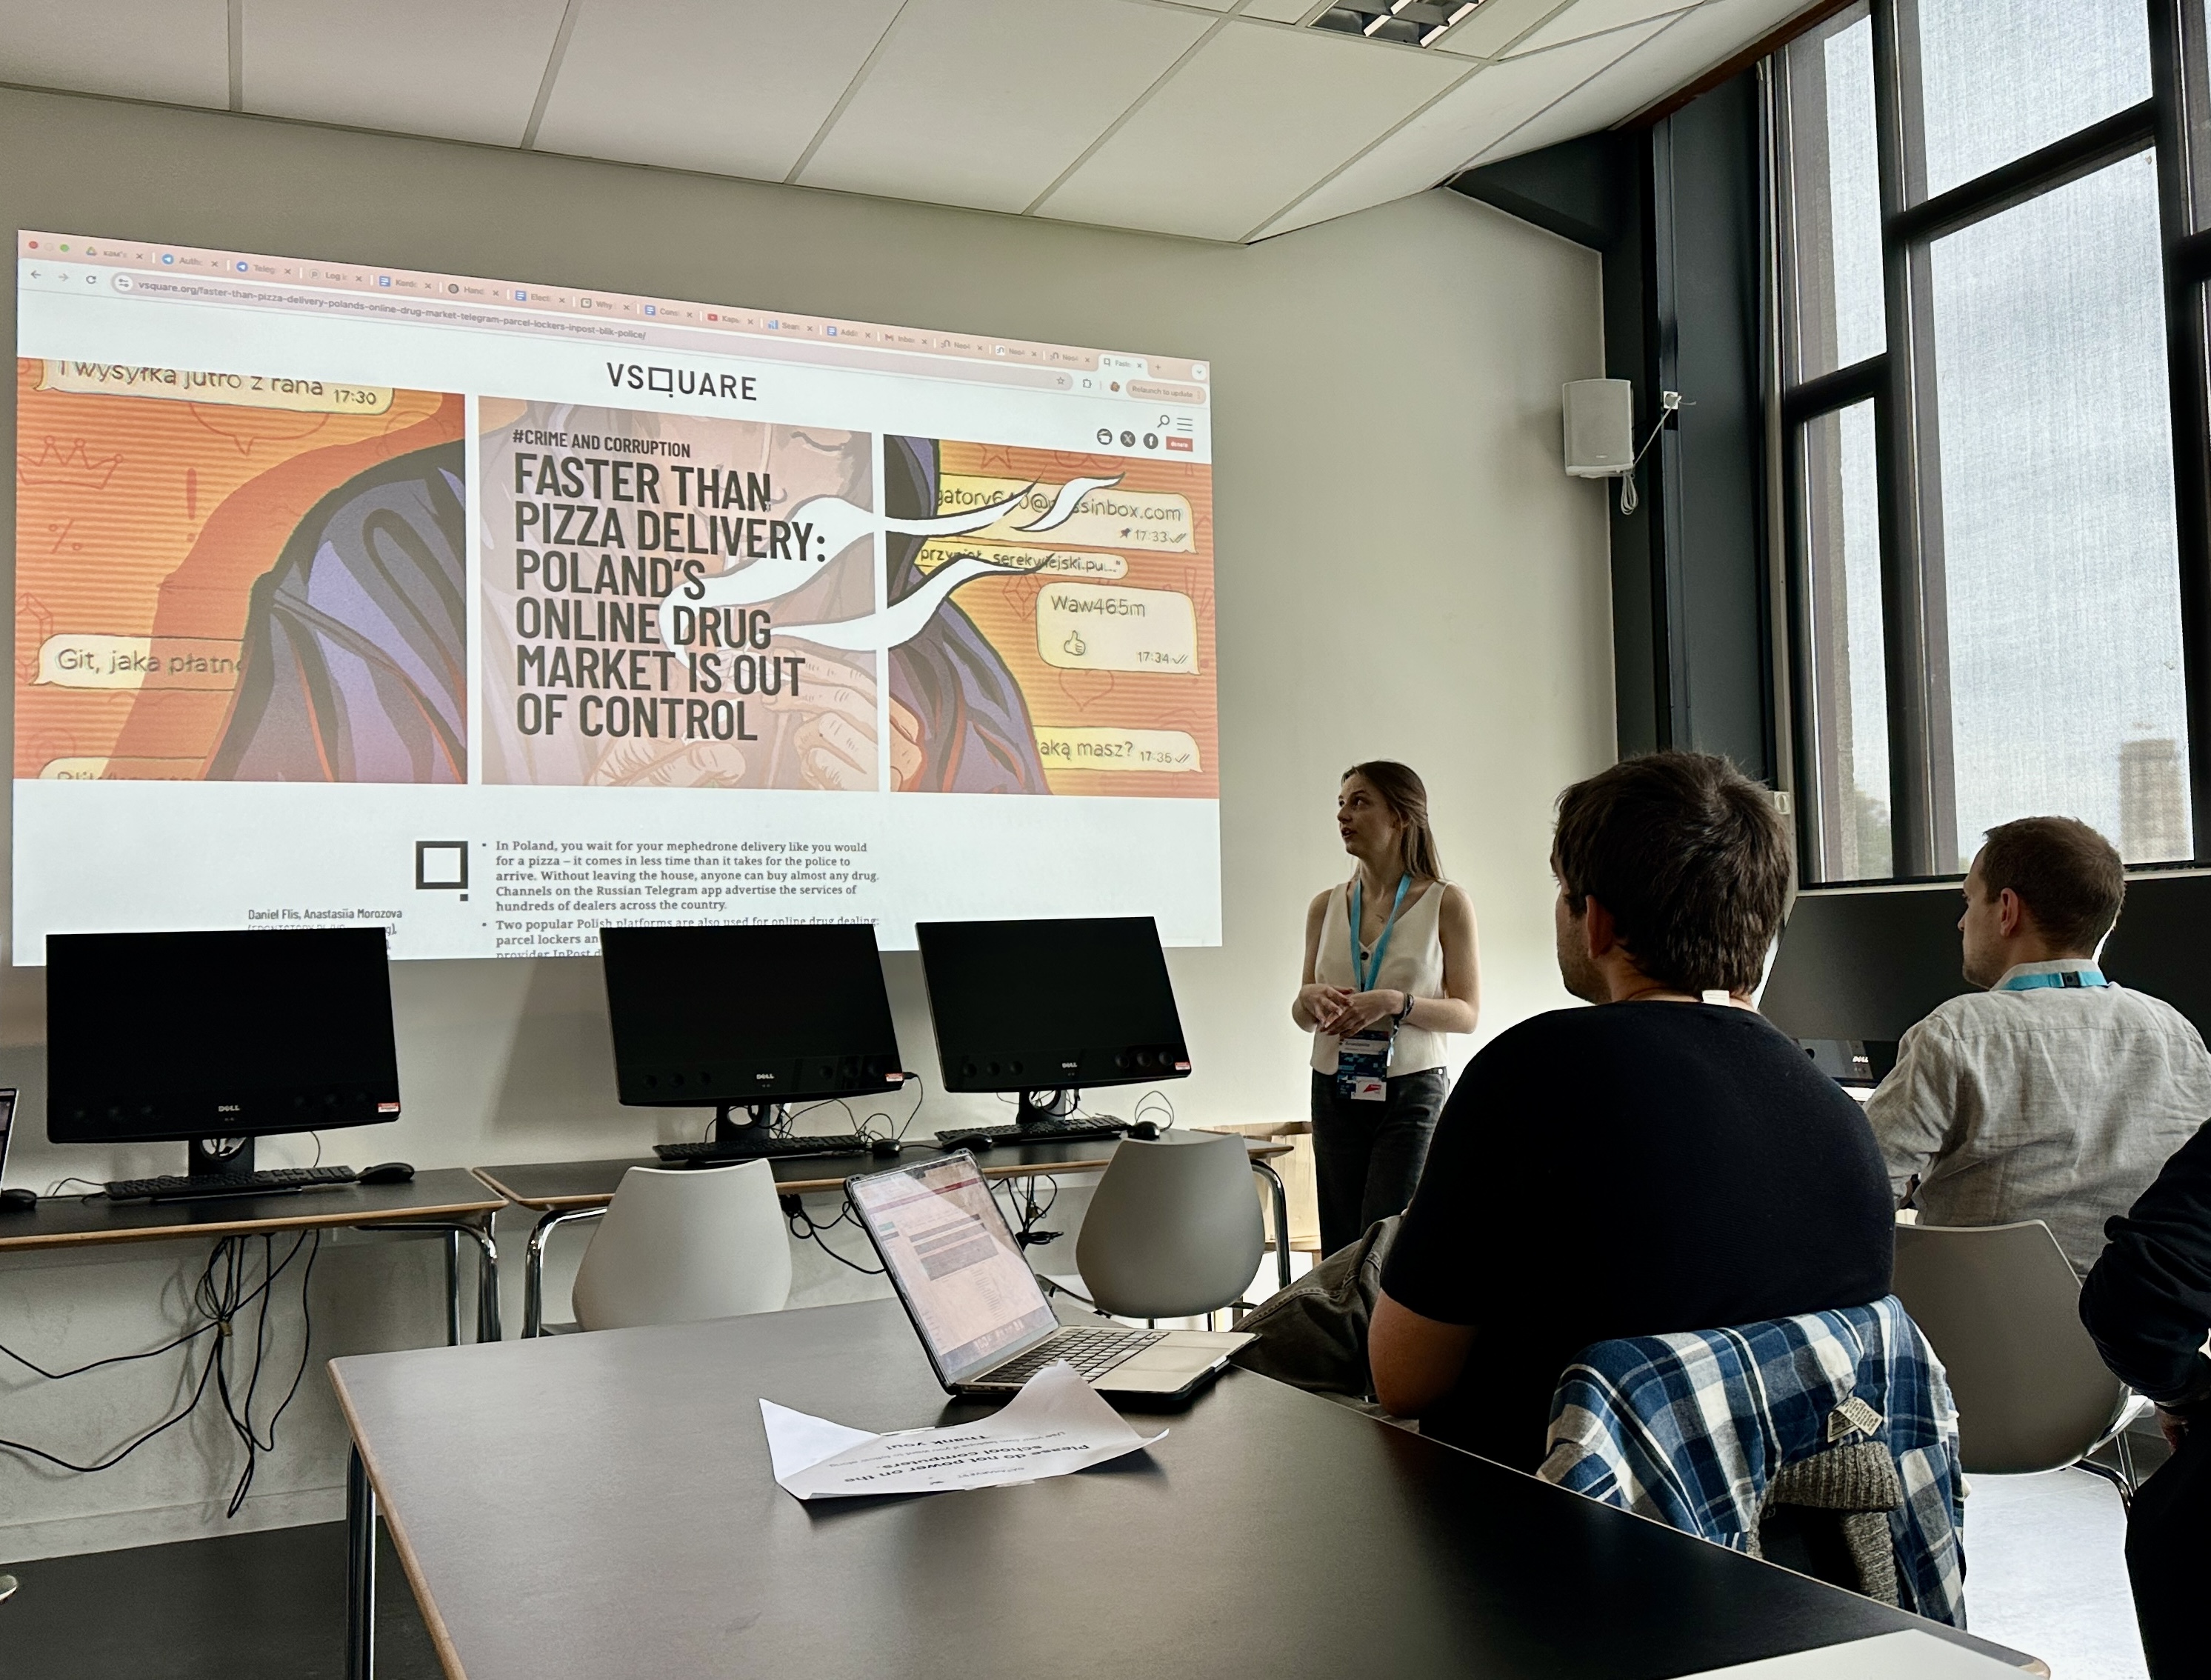
In 2025, I presented this methodology at Dataharvest, the European investigative journalism conference. The great thing about conferences is that you don’t just share your work — you find people who want to build on it. That’s how I connected with the Urban Journalism Network, and we’re now working on a similar investigation for Germany.